Open the Spotlight Overview page
Tap on a Spotlight Connection to open the Spotlight Overview page for that connection. For example:
- Tap on a Spotlight Connection on the Heatmap
- Tap on a Spotlight Connection on the Connections display
Tap the  Spotlight Overview page icon to return to the Spotlight Overview page for the connection.
About the Spotlight Overview page
Panels
If a panel’s color is other than green then at least one of the panel’s components is in an alarm state. The panel is colored according to the severity of the highest alarm raised against a panel component. Tap the panel to show the panel’s components.
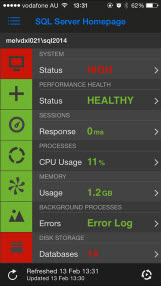
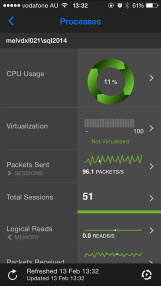
Flows and components
If a component’s color is other than green then the component is in an alarm state. Tap the component to show the alarms raised against the component.
If the component’s color is green then tap the component for help on the component.
Tailored to the connection type
The Spotlight Overview page flows and components are tailored to the connection type.
- Spotlight Overview page for Analysis Services
- Spotlight Overview page for Availability Group connections
- Spotlight Overview page for Azure SQL Managed Instance Connections
- Spotlight Overview page for Hyper-V connections
- Spotlight Overview page for Replication connections
- Spotlight Overview page for SQL Azure
- Spotlight Overview page for SQL Server connections
- Spotlight Overview page for Unix/Linux Connections
- Spotlight Overview page for VMware connections
- Spotlight Overview page for Windows Server connections
- Spotlight Overview page for the Spotlight Diagnostic Server