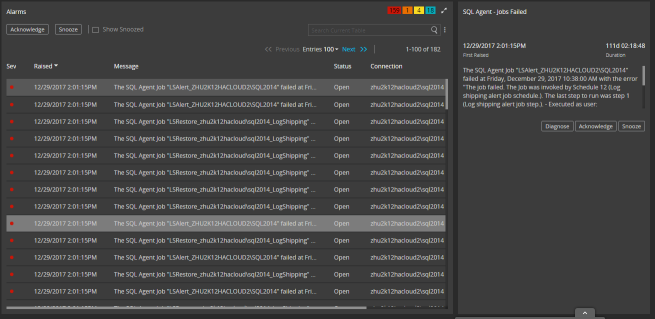
Use the Alarms page to comprehensively inquire into all outstanding alarms.

How to open the Alarms page
- From a web browser, open the Spotlight Cloud web site - http://www.spotlightcloud.io.
- Sign in using your Quest account. You have already signed in if you see your profile icon
 in the top right corner of the screen. If you see a
  link then you need to sign in.
 - Click the Monitoring tab.
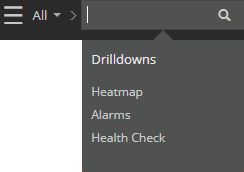
- Select Alarms from the available display pages.

Alarms summary
From the summary you can see the number of alarms raised of each severity. You can search for text within the alarms list. To page through multiple pages of alarms, click Next.

Tip: By default snoozed alarms are not shown. Click Show Snoozed to show snoozed alarms.
Tip: To Acknowledge or Snooze multiple alarms, select those alarms on the list. Use Ctrl or Shift to select multiple alarms.
Alarms list
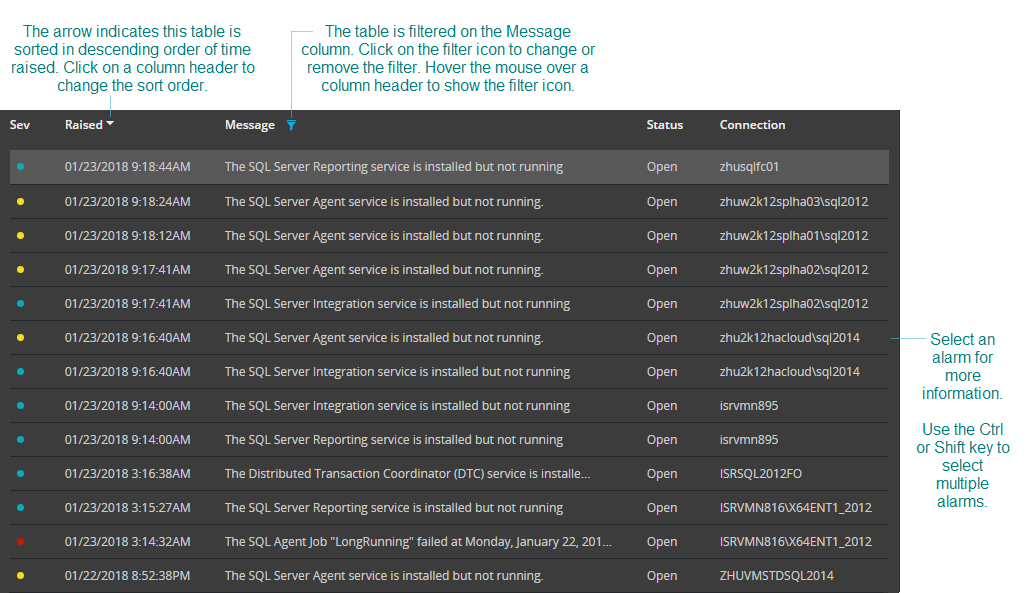
Use the arrow right of the column header to sort the list of alarms ascending or descending on any column. Hover the mouse over a column header to see a filter icon; use the filter icon to filter the list of alarms. Select an alarm to show detailed information on that alarm.

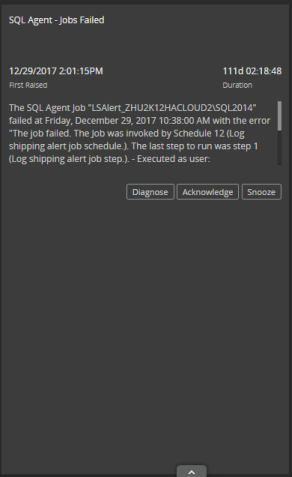
Select an alarm
Spotlight Cloud shows a description of the alarm. Click Acknowledge to acknowledge the alarm. Click Snooze to snooze the alarm.

Color and severity
Alarm severity is color coded throughout Spotlight Cloud.
| Default Color | Severity | Description |
|---|---|---|
| Normal | No alarms raised. | |
| Information | An information alarm has been raised. | |
| Low | A low severity alarm has been raised. | |
| Medium | A medium severity alarm has been raised. | |
| High | A high severity alarm has been raised. |