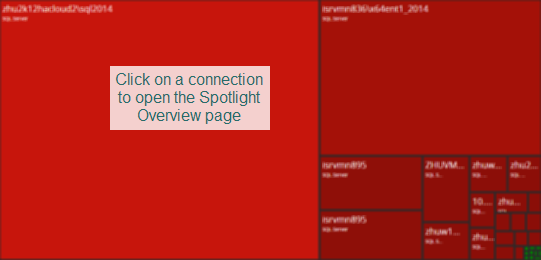
The Heat Map display organizes connections based on the comparative number and severity of alarms raised against them. Connections with the most alarms raised against them are given the most surface area on the heat map. The heat map refreshes itself automatically when connections are added and removed and when there is a change in the alarm status. Connections are removed from the heat map when monitoring is disabled and while they are in planned outage. The Heat Map answers the question: Which monitored connections require the most urgent attention?
Open the Heat map
- From a web browser, open the Spotlight Cloud web site - http://www.spotlightcloud.io.
- Sign in using your Quest account. You have already signed in if you see your profile icon
 in the top right corner of the screen. If you see a
  link then you need to sign in.
 - Click the Monitoring tab. The Heat map is the opening Monitoring screen.
Connection color and surface area
The Heat Map display organizes connections based on the comparative number and severity of alarms raised against them. Connections with the most alarms raised against them are given the most surface area on the heat map. Connections are colored according to the most severe current alarm.
| Default Color | Severity | Description |
|---|---|---|
| Normal | No alarms are raised against this connection. | |
| Information | At least one information alarm is raised against this connection. No other alarms are raised. | |
| Low | At least one low severity alarm is raised against this connection. No high or medium severity alarms are raised. | |
| Medium | At least one medium severity alarm is raised against this connection. No high severity alarms are raised. | |
| High | At least one high severity alarm is raised against this connection. |
Note: Connections in planned outage are automatically removed from the Heatmap.
Show more of a connection
Click on a connection on the surface area of the Heatmap to open the Spotlight Overview page for the connection.

Inquire into raised alarms
Open the Alarms panel. From the top right of the Heatmap page, click  .
.