The top right corner of the drilldown page indicates the current Auto Refresh status and either the time of the last screen refresh or the time period covered by the data displayed on the page.
| Monitoring Page Display | Description |
|---|---|
 |
The Heatmap and Spotlight Overview pages are updated in real time (Auto Refresh ON). The page from this display was last updated a few seconds ago. |
 |
The Alarms page is not updated once the screen is drawn (Auto Refresh OFF). The time of the last refresh is given. |
 |
The page may show Auto Refresh OFF and give the range of time involved in the data analysis. |
 |
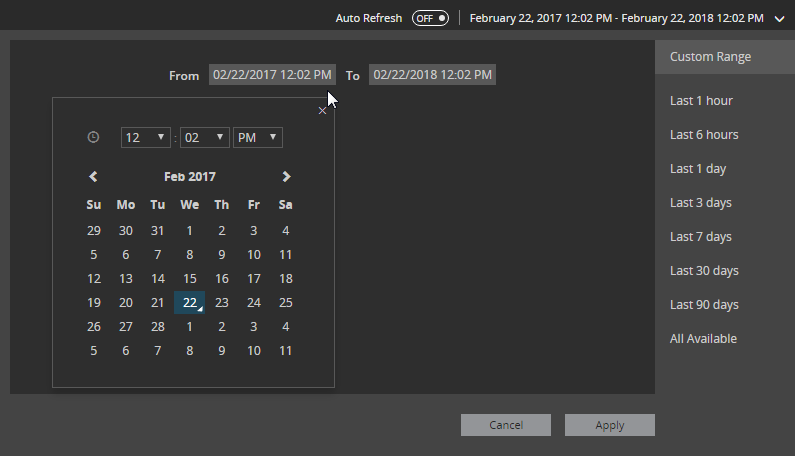
If the display has a down arrow to the right of the time then historical data is available. Click on the down arrow for options. |
 |
Next to Auto Refresh is a button that you can click to switch Auto Refresh ON or OFF. For some pages like this one you cannot turn Auto Refresh off. Data is real time only. |
Change the time period
If there is an arrow to the right of the time period display then the page has an option to change the time period covered by the data display. Click the arrow to show options.

Choose from the custom time periods (Last 1 hour, Last 6 hours, etc) or define your own time period. Click on the From date and time and To date and time periods to define your own time period.
