A Spotlight overview page captures the performance of a single monitored connection. Flows and components are updated in real time to highlight obvious bottlenecks and problem areas and color coded to indicate when an alarm is raised.
Open the Spotlight Overview page
- From a web browser, open the Spotlight Cloud web site - http://www.spotlightcloud.io.
- Sign in using your Quest account. You have already signed in if you see your profile icon
 in the top right corner of the screen. If you see a
  link then you need to sign in.
 - Click the Monitoring tab.
-
Ways to open the Spotlight Overview page from the Monitoring screen:
- Click on a connection on the Heat Map
- Click on a connection on the Connections Display.
Flows and components tailored to the connection type
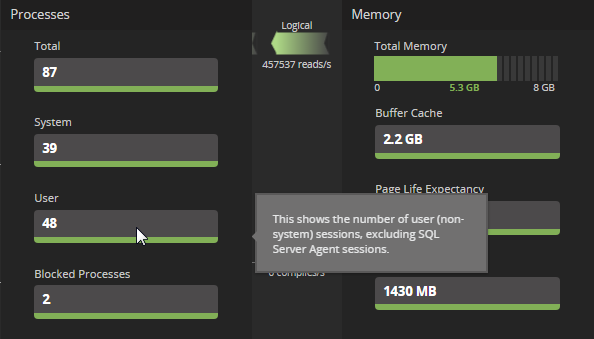
The Spotlight Overview page flows and components are tailored to the connection type. Hover your mouse over a component for a description.
Component color
Spotlight Overview page components are colored. If the color is other than green then the component is in an alarm state. If more than one alarm is raised against the component then the color shows the highest severity alarm raised.
| Default Color | Severity |
|---|---|
| Disabled | |
| Normal / No alarm is currently raised. | |
| Information | |
| Low | |
| Medium | |
| High |
Flows and components in an alarm state
Open the Alarms panel. From the top right of the Overview page, click  .
.