Open the Diagnostic Server page
- From a web browser, open the Spotlight Cloud web site - http://www.spotlightcloud.io.
- Sign in using your Quest account. You have already signed in if you see your profile icon
 in the top right corner of the screen. If you see a
  link then you need to sign in.
 - Click on your profile icon .
- Select Account Settings. This opens Your Profile page.
- Select Diagnostic Server from the menu to the left of the screen.
About the Diagnostic Server
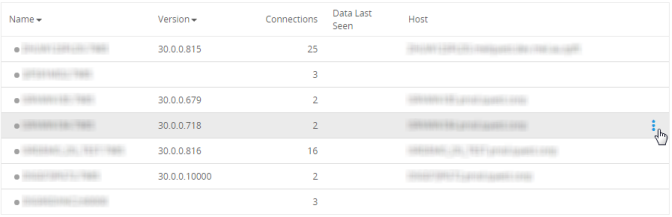
The table in the middle of the screen lists the Diagnostic Servers in your organization.
| Column | Description |
|---|---|
| Color | Green when no alarms are raised against the Diagnostic Server. Other colors indicate an alarm has been raised against the Diagnostic Server; the color indicates the severity of the alarm raised or the highest severity of all the alarms raised. |
| Name | The name of the Diagnostic Server. |
| Version | The Diagnostic Server version. |
| Connections | The number of connections monitored via the Diagnostic Server. |
| Data Last Seen | The date data was last uploaded by the Diagnostic Server to Spotlight Cloud. |
| Host | Where known / monitored, the Diagnostic Server host. |
Actions on the Diagnostic Server: View Alarms or Remove from Monitoring
Hover the mouse over the far right of the table till two blue dots appear for the Diagnostic Server row. Left click to see the actions you can take on this Diagnostic Server.
Click View Alarms to view the alarms currently raised against the Diagnostic Server. This opens the Alarms Page.
Click Remove from Monitoring to remove an unused Spotlight Cloud Diagnostic Server and all connections monitored through the Diagnostic Server from the Spotlight Cloud web site displays. Removal is permanent for unused Diagnostic Server. If the Diagnostic Server is still in use then removal from the Spotlight web site displays is temporary (until the next Diagnostic Server upload).
Sort, Search, Paginate
- The table can be sorted in ascending or descending order by any column. Click on the column header to sort by that column. Click again to reverse the sort order.
- Use the search facility at the top of the page to search the table for matching text.
- Use the pagination facility bottom right of the table if the number of Diagnostic Servers in your organization takes up multiple pages.