Sign in & Monitor
- From a web browser, open the Spotlight Cloud web site - http://www.spotlightcloud.io.
- Sign in using your Quest account. You have already signed in if you see your profile icon
 in the top right corner of the screen. If you see a
  link then you need to sign in.
 - Click the Monitoring tab.
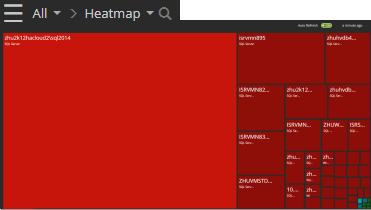
- The Heat Map is the opening page.
Select Connections
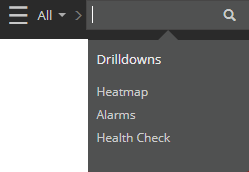
From the menu top of the page, All indicates that all monitored connections are on display.
Click All to open a drop down menu of available connections and connection groups.

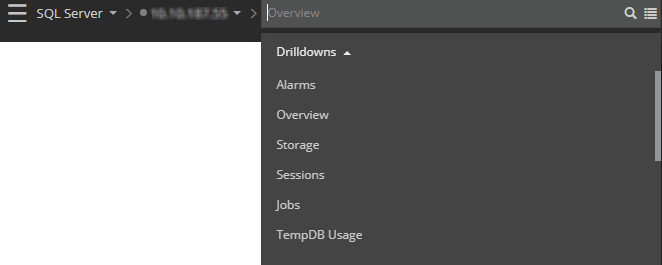
Select a connection to show the Spotlight Overview Page for the connection.
Select Monitoring page
When All connections or a connection group is selected then the Heat Map is one available display. The Alarms Page is a display of all outstanding alarms for the selected connections.
When a single connection is selected the Overview Page is one available display. The Alarms Page is a display of all outstanding alarms for the selected connection.
Connections side pane
Click  to show / hide the Connections pane.
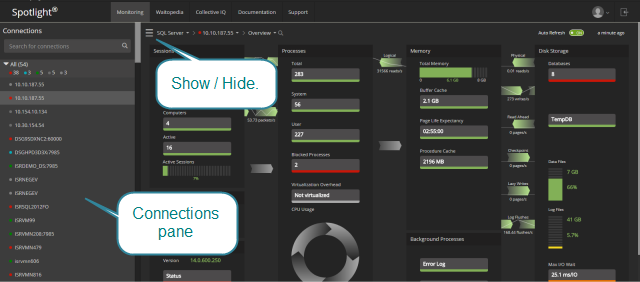
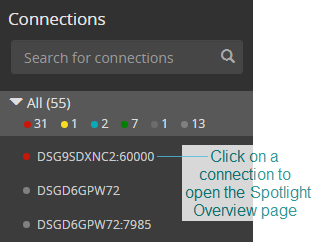
From the Connections pane, click on a connection to open the Overview Page for the connection. Click on a connection group to open the Heatmap for the group.
Search
Filter the list of connections on the Connections display. To filter this list of connections, type text in the Search field. The search matches against the connection name.
Open a Heat Map
Click on a connection vew to show those connections on a Heat Map.
Open the Spotlight Overview page
Click on a connection to see that connection on a Spotlight Overview page.