Get the range of values available for use in our queries
We want to know the names of the available data sources and the names and domains of the monitored objects.
In SQL Server Management Studio, create a new query against the Spotlight Statistics Repository.
Use the [Spotlight API stored procedures][enterprise_ssrquery_storedprocedures_api] to browse the dimension tables.
Return a list of data sources in the repository
Run the query:
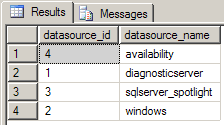
exec spotlight_get_datasources
To return the results:

We can see here that we have data from Windows, SQL Server, the Diagnostic Server and alarms (availability).
Return the name(s) of the Diagnostic Server(s) storing data in the repository
Run the query:
exec spotlight_get_domains
To return the results:

We can see here that there is one Diagnostic Server writing data to this repository. There can be multiple Diagnostic Servers, each one resulting in a row.
Return information about the servers being monitored
Run the query:
exec spotlight_get_monitored_objects
To return the results:

Return the range of timestamps available for all monitored servers
Run the query:
select

so.monitored_object_name,

min(st.timecollected) as 'start',

max(st.timecollected) as 'end'

from

spotlight_timestamps st

join spotlight_monitored_objects so on st.monitored_object_id = so.monitored_object_id

group by

so.monitored_object_name
To return the results:

What statistics are available to us?
Now that we have some information about the Diagnostic Server, monitored servers and categories of collections in the Spotlight Statistics Repository, we want to know what statistics are available to us.
The spotlight_get_tables stored procedure returns a list of tables in the repository for a given data source. Since we are looking for SQL Server data, from our first query above, we know that the datasource is sqlserver_spotlight. Use that as the parameter to run the query:
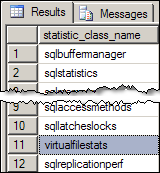
exec spotlight_get_tables 'sqlserver_spotlight'
To return the results:

Virtual file stats as an access to file IO statistics
Run this query to find out what columns are available in the virtual file stats table. Specify the datasource and table name.
exec spotlight_get_table_columns 'sqlserver_spotlight','virtualfilestats'
We need to produce the report over a time range, but for curiosity’s sake, we would like to find out the time range of all stored data for a particular domain name, monitored object, and table combination. Run the spotlight_get_table_span stored procedure and specify the domain name, monitored object, and table name.
exec spotlight_get_table_span 'DS123:3843','Windows01_SQLServer789_sqlserver','virtualfilestats'

Query the fact table
We’ll use the spotlight_get_table_range stored procedure and specify the following:
- start date
- end date
- domain name
- monitored object
- table name
Spotlight_get_table_range returns data for the requested time range for a table, for a particular monitored object and domain.
Query
Run the query:
exec spotlight_get_table_range '2009-03-26 11:15:16.153','2009-07-26 17:15:17.113', 'DS123:3843','Windows01_SQLServer789_sqlserver', 'virtualfilestats'
Results
The query returns all columns for the table virtualfilestats. Although there is a lot of useful data in this query result, it is not ideal.

Sample T-SQL query
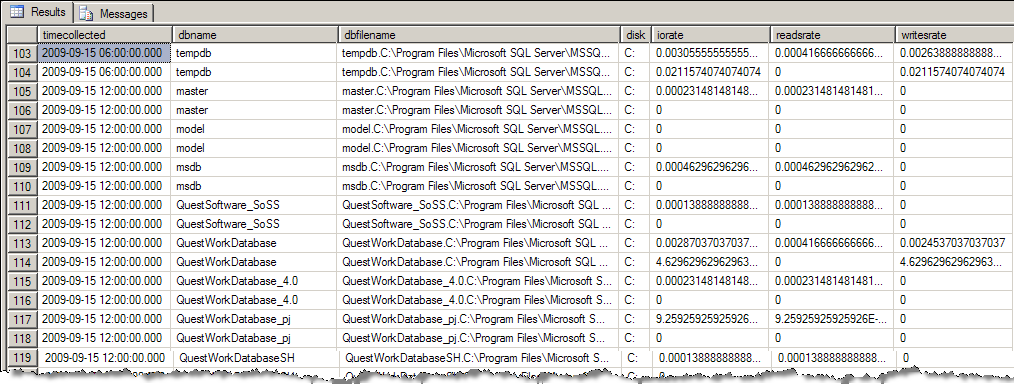
This is a sample T-SQL query to refine the data returned from the Spotlight Statistics Repository. Following on from the example above, if we want to retrieve only certain columns from the virtualfilestats table, we can use custom T-SQL to return specific data. To return only the ‘iorate’, ‘disk’, ‘readsrate’, and ‘writesrate’ columns from the ‘virtualfilestats’ table, we can use the following custom T-SQL:
select

sp.timecollected,

max(case when sn.statistic_name = 'dbname' then sp.raw_value end) as 'dbname',

max(case when sn.statistic_name = 'dbfilename' then sp.raw_value end) as 'dbfilename',

max(case when sn.statistic_name = 'disk' then sp.raw_value end) as 'disk',

max(case when sn.statistic_name = 'iorate' then sp.raw_value end) as 'iorate',

max(case when sn.statistic_name = 'readsrate' then sp.raw_value end) as 'readsrate',

max(case when sn.statistic_name = 'writesrate' then sp.raw_value end) as 'writesrate'

from

spotlight_perfdata sp

join spotlight_stat_classes sc on sp.statistic_class_id = sc.statistic_class_id

join spotlight_stat_names sn on sp.statistic_name_id = sn.statistic_name_id

join spotlight_monitored_objects so on sp.monitored_object_id = so.monitored_object_id

where

sc.statistic_class_name = 'virtualfilestats'

and so.monitored_object_name = 'Windows01_SQLServer789_sqlserver'

and sp.timecollected between '2009-09-01' and '2009-09-30'

group by

sp.timecollected, sp.statistic_key_id

order by

sp.timecollected
results
The T-SQL gives us the following results:

Query Custom Counters
SQL Server custom counters are stored in the statistic class sqlcustomcounters and Windows custom counters are stored in the class windowscustomcounters. Use [Spotlight API Stored Procedures][enterprise_ssrquery_storedprocedures_api] to retrieve date ranges and column names with these like any other data collection.
Sample T-SQL Query
This is a sample T-SQL statement that retrieves SQL Server custom counter values.
select

sp.timecollected,

max(case when sn.statistic_name = 'countername' then sp.raw_value end) as 'countername',

max(case when sn.statistic_name = 'countervalue' then sp.raw_value end) as 'countervalue'

from

spotlight_perfdata sp

join spotlight_stat_classes sc on sp.statistic_class_id = sc.statistic_class_id

join spotlight_stat_names sn on sp.statistic_name_id = sn.statistic_name_id

join spotlight_monitored_objects so on sp.monitored_object_id = so.monitored_object_id

where

sc.statistic_class_name = 'sqlcustomcounters'

and so.monitored_object_name = 'Windows01_SQLServer789_sqlserver'

and sp.timecollected between '2009-09-01' and '2009-09-30'

group by

sp.timecollected, sp.statistic_key_id

order by

sp.timecollected
Results
These are the results returned for the custom counter Pages Allocated.

Query alarm data
Querying alarm data is the same as querying other data stored in the repository. Alarm data is stored in a statistic class called ‘alarms’.
Sample T-SQL Query
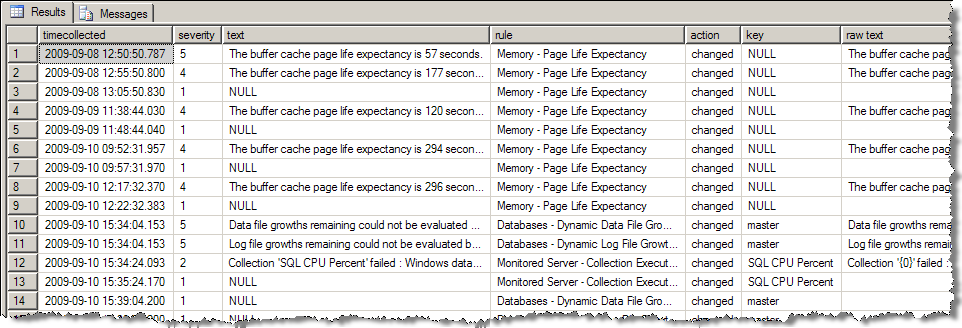
This is a sample T-SQL statement that can be used to retrieve alarm data. Required parameters: monitored object name, start and end times.
select

sp.timecollected,

max(case when sn.statistic_name = 'severity' then sp.raw_value end) as 'severity',

max(case when sn.statistic_name = 'text' then sp.raw_value end) as 'text',

max(case when sn.statistic_name = 'rule' then sp.raw_value end) as 'rule',

max(case when sn.statistic_name = 'action' then sp.raw_value end) as 'action',

max(case when sn.statistic_name = 'key' then sp.raw_value end) as 'key',

max(case when sn.statistic_name = 'raw text' then sp.raw_value end) as 'raw text'

from

spotlight_perfdata sp

join spotlight_stat_classes sc on sp.statistic_class_id = sc.statistic_class_id

join spotlight_stat_names sn on sp.statistic_name_id = sn.statistic_name_id

join spotlight_monitored_objects so on sp.monitored_object_id = so.monitored_object_id

where

sc.statistic_class_name = 'alarms'

and so.monitored_object_name = 'Windows01_SQLServer789_sqlserver'

and sp.timecollected between '2009-09-08' and '2009-09-17'

group by

sp.timecollected, sp.statistic_key_id

order by

sp.timecollected
Resuts
These are the resuts of the sample T-SQL query.
